XB-IMG-81921
Xenbase Image ID: 81921
|
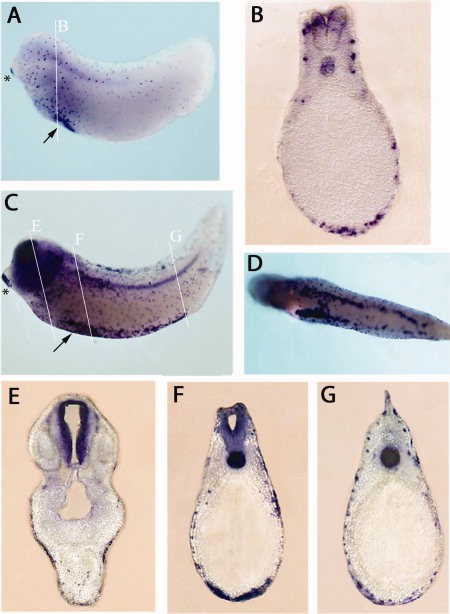
Figure 6. Expression of Fermt3 at stage 28 and 35. A, B:Fermt3 transcripts are detected at stage 28 in the cement gland (asterisk), notochord, anterior ventral blood islands (back arrow), and in early myeloid progenitor cells. White line in A indicates the level at which this section (B) is taken. C: By stage 35, expression of Fermt3 is visible in the cement gland (C, asterisk), central nervous system (C, E, F), ventral blood islands and vitelline veins (5C, black arrow, D, F), notochord (C, F, G), and in myeloid cells (C, D, F, G). Ventral view of a stage-35 embryo is shown is D and transverse sections are presented (E), the levels of which are demarcated by white lines (C). Image published in: Canning CA et al. (2011) Copyright © 2011. Image reproduced with permission of the Publisher, John Wiley & Sons.
Image source: Published Larger Image Printer Friendly View |