XB-ART-54154
Nucleic Acids Res
2017 Sep 29;4517:9917-9930. doi: 10.1093/nar/gkx579.
Show Gene links
Show Anatomy links
HMGN1 and 2 remodel core and linker histone tail domains within chromatin.
Murphy KJ
,
Cutter AR
,
Fang H
,
Postnikov YV
,
Bustin M
,
Hayes JJ
.
???displayArticle.abstract???
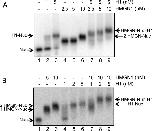
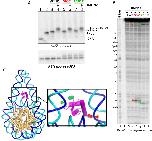
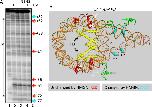
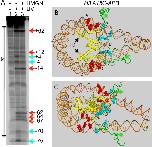
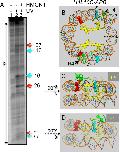
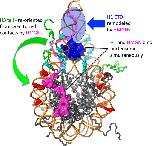
The structure of the nucleosome, the basic building block of the chromatin fiber, plays a key role in epigenetic regulatory processes that affect DNA-dependent processes in the context of chromatin. Members of the HMGN family of proteins bind specifically to nucleosomes and affect chromatin structure and function, including transcription and DNA repair. To better understand the mechanisms by which HMGN 1 and 2 alter chromatin, we analyzed their effect on the organization of histone tails and linker histone H1 in nucleosomes. We find that HMGNs counteract linker histone (H1)-dependent stabilization of higher order 'tertiary' chromatin structures but do not alter the intrinsic ability of nucleosome arrays to undergo salt-induced compaction and self-association. Surprisingly, HMGNs do not displace H1s from nucleosomes; rather these proteins bind nucleosomes simultaneously with H1s without disturbing specific contacts between the H1 globular domain and nucleosomal DNA. However, HMGNs do alter the nucleosome-dependent condensation of the linker histone C-terminal domain, which is critical for stabilizing higher-order chromatin structures. Moreover, HMGNs affect the interactions of the core histone tail domains with nucleosomal DNA, redirecting the tails to more interior positions within the nucleosome. Our studies provide new insights into the molecular mechanisms whereby HMGNs affect chromatin structure.
???displayArticle.pubmedLink??? 28973435
???displayArticle.pmcLink??? PMC5622319
???displayArticle.link??? Nucleic Acids Res
???displayArticle.grants??? [+]
Species referenced: Xenopus laevis
Genes referenced: gh1 hmgn1 hmgn2
GO keywords: nucleosome [+]
???attribute.lit??? ???displayArticles.show???
References [+] :
Albright,
Subunit structures of different electrophoretic forms of nucleosomes.
1980, Pubmed
Albright, Subunit structures of different electrophoretic forms of nucleosomes. 1980, Pubmed
Alfonso, The footprint of chromosomal proteins HMG-14 and HMG-17 on chromatin subunits. 1994, Pubmed
Allahverdi, The effects of histone H4 tail acetylations on cation-induced chromatin folding and self-association. 2011, Pubmed
Allan, Roles of H1 domains in determining higher order chromatin structure and H1 location. 1986, Pubmed
Barbera, The nucleosomal surface as a docking station for Kaposi's sarcoma herpesvirus LANA. 2006, Pubmed , Xenbase
Bednar, Structure and Dynamics of a 197 bp Nucleosome in Complex with Linker Histone H1. 2017, Pubmed , Xenbase
Birger, Chromosomal protein HMGN1 enhances the rate of DNA repair in chromatin. 2003, Pubmed
Brawley, HMG proteins 14 and 17 become cross-linked to the globular domain of histone H3 near the nucleosome core particle dyad. 1992, Pubmed
Carruthers, Linker histones stabilize the intrinsic salt-dependent folding of nucleosomal arrays: mechanistic ramifications for higher-order chromatin folding. 1998, Pubmed
Caterino, Nucleosome linker DNA contacts and induces specific folding of the intrinsically disordered H1 carboxyl-terminal domain. 2011, Pubmed , Xenbase
Catez, Competition between histone H1 and HMGN proteins for chromatin binding sites. 2002, Pubmed
Chakravarthy, Structure and dynamic properties of nucleosome core particles. 2005, Pubmed
Chodaparambil, A charged and contoured surface on the nucleosome regulates chromatin compaction. 2007, Pubmed
Clark, Electrostatic mechanism of chromatin folding. 1990, Pubmed
Crippa, Nucleosome core binding region of chromosomal protein HMG-17 acts as an independent functional domain. 1992, Pubmed
Cuddapah, Genomic profiling of HMGN1 reveals an association with chromatin at regulatory regions. 2011, Pubmed
Cutter, A brief review of nucleosome structure. 2015, Pubmed
Cutter, Linker histones: novel insights into structure-specific recognition of the nucleosome. 2017, Pubmed , Xenbase
Davey, Solvent mediated interactions in the structure of the nucleosome core particle at 1.9 a resolution. 2002, Pubmed , Xenbase
Deng, Functional compensation among HMGN variants modulates the DNase I hypersensitive sites at enhancers. 2015, Pubmed
Deng, HMGN1 modulates nucleosome occupancy and DNase I hypersensitivity at the CpG island promoters of embryonic stem cells. 2013, Pubmed
Ding, Stimulation of RNA polymerase II elongation by chromosomal protein HMG-14. 1994, Pubmed
Ding, Alleviation of histone H1-mediated transcriptional repression and chromatin compaction by the acidic activation region in chromosomal protein HMG-14. 1997, Pubmed
Fang, DNA and nucleosomes direct distinct folding of a linker histone H1 C-terminal domain. 2012, Pubmed , Xenbase
Fang, Chromatin structure-dependent conformations of the H1 CTD. 2016, Pubmed
Gordon, The core histone N-terminal tail domains function independently and additively during salt-dependent oligomerization of nucleosomal arrays. 2005, Pubmed , Xenbase
Graziano, Interaction of HMG14 with chromatin. 1990, Pubmed
Grigoryev, Hierarchical looping of zigzag nucleosome chains in metaphase chromosomes. 2016, Pubmed
Hansen, Intrinsic protein disorder, amino acid composition, and histone terminal domains. 2006, Pubmed
Hansen, Conformational dynamics of the chromatin fiber in solution: determinants, mechanisms, and functions. 2002, Pubmed
Hendzel, The C-terminal domain is the primary determinant of histone H1 binding to chromatin in vivo. 2004, Pubmed
Hill, Effects of HMGN1 on chromatin structure and SWI/SNF-mediated chromatin remodeling. 2005, Pubmed
Kan, The H4 tail domain participates in intra- and internucleosome interactions with protein and DNA during folding and oligomerization of nucleosome arrays. 2009, Pubmed
Kato, Architecture of the high mobility group nucleosomal protein 2-nucleosome complex as revealed by methyl-based NMR. 2011, Pubmed
Kugler, The HMGN family of chromatin-binding proteins: dynamic modulators of epigenetic processes. 2012, Pubmed
Li, Distinct Roles of Histone H3 and H2A Tails in Nucleosome Stability. 2016, Pubmed
Lim, Chromosomal protein HMGN1 modulates histone H3 phosphorylation. 2004, Pubmed
Lim, Chromosomal protein HMGN1 enhances the acetylation of lysine 14 in histone H3. 2005, Pubmed
Lim, Preparation and functional analysis of HMGN proteins. 2004, Pubmed
Lu, Identification of specific functional subdomains within the linker histone H10 C-terminal domain. 2004, Pubmed
Maeshima, Nucleosomal arrays self-assemble into supramolecular globular structures lacking 30-nm fibers. 2016, Pubmed
Pepenella, Intra- and inter-nucleosome interactions of the core histone tail domains in higher-order chromatin structure. 2014, Pubmed
Pepenella, A distinct switch in interactions of the histone H4 tail domain upon salt-dependent folding of nucleosome arrays. 2014, Pubmed , Xenbase
Perry, Influence of histone acetylation on the solubility, H1 content and DNase I sensitivity of newly assembled chromatin. 1989, Pubmed
Postnikov, Homodimers of chromosomal proteins HMG-14 and HMG-17 in nucleosome cores. 1995, Pubmed
Postnikov, Regulation of chromatin structure and function by HMGN proteins. 2010, Pubmed
Postnikov, Functional interplay between histone H1 and HMG proteins in chromatin. 2016, Pubmed
Rochman, The interaction of NSBP1/HMGN5 with nucleosomes in euchromatin counteracts linker histone-mediated chromatin compaction and modulates transcription. 2009, Pubmed
Sandeen, The interaction of high mobility proteins HMG14 and 17 with nucleosomes. 1980, Pubmed
Schauwecker, Histone H1 and Chromosomal Protein HMGN2 Regulate Prolactin-induced STAT5 Transcription Factor Recruitment and Function in Breast Cancer Cells. 2017, Pubmed
Schwarz, Reversible oligonucleosome self-association: dependence on divalent cations and core histone tail domains. 1996, Pubmed
Shaytan, Coupling between Histone Conformations and DNA Geometry in Nucleosomes on a Microsecond Timescale: Atomistic Insights into Nucleosome Functions. 2016, Pubmed , Xenbase
Shick, Primary organization of nucleosomes. Interaction of non-histone high mobility group proteins 14 and 17 with nucleosomes, as revealed by DNA-protein crosslinking and immunoaffinity isolation. 1985, Pubmed
Stützer, Modulations of DNA Contacts by Linker Histones and Post-translational Modifications Determine the Mobility and Modifiability of Nucleosomal H3 Tails. 2016, Pubmed , Xenbase
Syed, Single-base resolution mapping of H1-nucleosome interactions and 3D organization of the nucleosome. 2010, Pubmed
Trieschmann, Incorporation of chromosomal proteins HMG-14/HMG-17 into nascent nucleosomes induces an extended chromatin conformation and enhances the utilization of active transcription complexes. 1995, Pubmed , Xenbase
Trieschmann, The chromatin unfolding domain of chromosomal protein HMG-14 targets the N-terminal tail of histone H3 in nucleosomes. 1998, Pubmed
Ueda, Delineation of the protein module that anchors HMGN proteins to nucleosomes in the chromatin of living cells. 2008, Pubmed
Vestner, Stimulation of replication efficiency of a chromatin template by chromosomal protein HMG-17. 1998, Pubmed , Xenbase
Wang, Acetylation mimics within individual core histone tail domains indicate distinct roles in regulating the stability of higher-order chromatin structure. 2008, Pubmed , Xenbase
Woodcock, Role of linker histone in chromatin structure and function: H1 stoichiometry and nucleosome repeat length. 2006, Pubmed
Zhou, Structural Mechanisms of Nucleosome Recognition by Linker Histones. 2015, Pubmed


