|
Figure 1. Homotrimeric ENaC forms functional channels except for γ. Electrophysiological characterization of homotrimeric ENaC (α, δ, β, and γ) vs. canonical ENaC (αβγ and δβγ) expressed in oocytes. Representative current traces of αβγ- (A), α- (B), β- (C), γ- (D), δβγ- (E), and δ-injected oocytes (F) in response to the application of amiloride (10μM). (C) Oocytes injected with ENaC encoding RNA revealed variable responses. Only a proportion of oocytes responded to amiloride, whereas the majority of oocytes did not show an amiloride response (Câ). (D) Oocytes injected with γ ENaC did not show a reaction in response to amiloride. (G) Amiloride dose response curve of αβγ, α, and β ENaC and calculated IC50 values for amiloride (H) showing a decreased amiloride sensitivity for β when compared with αβγ, whereas α is unchanged. (I) Amiloride dose response curves of δβγ and δ. (J) δ ENaC displays a significantly reduced amiloride IC50 value compared with δβγ. Paired t-test (AâF), one-way ANOVA with multiple comparison (H) and unpaired t-test (J); *p < 0.05; **p < 0.01; ***p < 0.001; ****p < 0.0001.
|

|
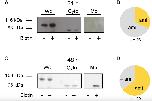
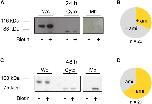
Figure 2. Biotinylation assay of β ENaC expressing oocytes. (A) Representative western blot showing β ENaC in presence (+) or absence (â) of biotin. Each group consists of the following three samples: whole cell (Wc), cytoplasmic (Cyto), and membrane bound (Mb). Exposure time for Wc and Cyto: 5 s and for Mb: 10 min N = 3. After an incubation of 24 h β ENaC was present in the Wc and Cyto fractions but absent in the Mb sample. It may also be noted that the Cyto and Mb fraction were treated with PNGase F, resulting in a lower molecular weight compared to the band detected in the Wc sample. (B) Fraction of β ENaC expressing oocytes exhibiting amiloride-sensitive currents (+ami) after 24 h incubation. (C) Increasing the incubation time of β ENaC to 48 h shows a clear band within the Mb fraction and increases the number of oocytes exhibiting amiloride-sensitive currents (D).
|

|
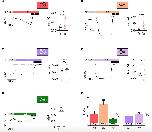
Figure 3. Homotrimeric ENaC except for γ is activated by SF. Electrophysiological characterization of homotrimeric ENaC in response to 0.2 dyn*cm– 2 SF (colored bar). (A) H2O-injected control oocytes neither respond to SF nor amiloride (10 μM). (B) SF response of αβγ ENaC is absent in presence of amiloride (10 μM). αβγ (C) and δβγ (D) ENaC are significantly activated by SF. Left panels show representative traces. The right panels show the averages ± SEM. Homotrimeric α, δ, and β (E–G, respectively) respond to SF, whereas γ (H) does not. (I) The SF response (I0.2/I0) of homotrimeric ENaC subunits was normalized with respect to canonical αβγ and δβγ ENaC. The SF response of α ENaC was unchanged while β ENaC showed a reduced SF effect when compared with αβγ. δ ENaC displayed an increased SF effect compared with canonical δβγ ENaC. Paired t-test (C–H) and one-way ANOVA with multiple comparison (I); *p < 0.05; **p < 0.01; ****p < 0.0001.
|

|
Figure 4. Heterotrimeric ENaC composed of two subunits form functional channels. (AâG) Effect of amiloride (10 μM) application on heterotrimeric ENaC currents of various subunit combinations (αβγ, αβ, αγ, βγ, δβγ, δβ, and δγ). (H) Dose response curves for amiloride were fitted and derived IC50 values were used for comparison (I). Amiloride sensitivity of αβ and αγ ENaC was statistically not different when compared with αβγ, whereas βγ ENaC displays a significantly increased IC50 value with respect to αβγ and αγ ENaC. (J) Dose-response curves for channels containing δ ENaC. (K) δγ displayed a significantly reduced amiloride IC50 value compared with δβγ, whereas δβ remains unchanged. Paired t-test (AâG) and one-way ANOVA with multiple comparison (I,K); **p < 0.01; ***p < 0.001; ****p < 0.0001.
|

|
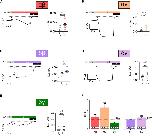
Figure 5. Heterotrimeric ENaC composed of two subunits responds to SF. SF response of heterotrimeric ENaC composed of two different subunits was assessed. Left panels show representative current traces whereas the right panels show the averages ± SEM. All combinations of two different ENaC subunits, αβ (A), αγ (B), δβ (C), δγ (D), and βγ (E), were significantly activated by the application of SF (indicated as colored bar). (F) The SF response (I0.2/I0) of those ENaC subunit compositions was normalized with respect to canonical αβγ and δβγ ENaC. The SF effect of αβ and βγ was unchanged when compared with αβγ. A significantly increased SF response was observed for αγ when compared with αβγ. δγ ENaC shows also a significantly increased SF effect when compared with δβγ, whereas δβ was unchanged. Paired t-test (A–E) and one-way ANOVA with multiple comparison (F); **p < 0.01; ***p < 0.001; ****p < 0.0001.
|

|
Supplementary Figure 1- Epithelial Na+ Channel (ENaC) Formed by One or Two Subunits Forms Functional Channels That Respond to Shear Force
|

|
Supplementary Figure 2- Epithelial Na+ Channel (ENaC) Formed by One or Two Subunits Forms Functional Channels That Respond to Shear Force
|

|
FIGURE 1. Homotrimeric ENaC forms functional channels except for γ. Electrophysiological characterization of homotrimeric ENaC (α, δ, β, and γ) vs. canonical ENaC (αβγ and δβγ) expressed in oocytes. Representative current traces of αβγ- (A), α- (B), β- (C), γ- (D), δβγ- (E), and δ-injected oocytes (F) in response to the application of amiloride (10μM). (C) Oocytes injected with ENaC encoding RNA revealed variable responses. Only a proportion of oocytes responded to amiloride, whereas the majority of oocytes did not show an amiloride response (Câ). (D) Oocytes injected with γ ENaC did not show a reaction in response to amiloride. (G) Amiloride dose response curve of αβγ, α, and β ENaC and calculated IC50 values for amiloride (H) showing a decreased amiloride sensitivity for β when compared with αβγ, whereas α is unchanged. (I) Amiloride dose response curves of δβγ and δ. (J) δ ENaC displays a significantly reduced amiloride IC50 value compared with δβγ. Paired t-test (AâF), one-way ANOVA with multiple comparison (H) and unpaired t-test (J); *p < 0.05; **p < 0.01; ***p < 0.001; ****p < 0.0001.
|

|
FIGURE 2. Biotinylation assay of β ENaC expressing oocytes. (A) Representative western blot showing β ENaC in presence (+) or absence (â) of biotin. Each group consists of the following three samples: whole cell (Wc), cytoplasmic (Cyto), and membrane bound (Mb). Exposure time for Wc and Cyto: 5 s and for Mb: 10 min N = 3. After an incubation of 24 h β ENaC was present in the Wc and Cyto fractions but absent in the Mb sample. It may also be noted that the Cyto and Mb fraction were treated with PNGase F, resulting in a lower molecular weight compared to the band detected in the Wc sample. (B) Fraction of β ENaC expressing oocytes exhibiting amiloride-sensitive currents (+ami) after 24 h incubation. (C) Increasing the incubation time of β ENaC to 48 h shows a clear band within the Mb fraction and increases the number of oocytes exhibiting amiloride-sensitive currents (D).
|

|
FIGURE 3. Homotrimeric ENaC except for γ is activated by SF. Electrophysiological characterization of homotrimeric ENaC in response to 0.2 dyn*cm– 2 SF (colored bar). (A) H2O-injected control oocytes neither respond to SF nor amiloride (10 μM). (B) SF response of αβγ ENaC is absent in presence of amiloride (10 μM). αβγ (C) and δβγ (D) ENaC are significantly activated by SF. Left panels show representative traces. The right panels show the averages ± SEM. Homotrimeric α, δ, and β (E–G, respectively) respond to SF, whereas γ (H) does not. (I) The SF response (I0.2/I0) of homotrimeric ENaC subunits was normalized with respect to canonical αβγ and δβγ ENaC. The SF response of α ENaC was unchanged while β ENaC showed a reduced SF effect when compared with αβγ. δ ENaC displayed an increased SF effect compared with canonical δβγ ENaC. Paired t-test (C–H) and one-way ANOVA with multiple comparison (I); *p < 0.05; **p < 0.01; ****p < 0.0001.
|

|
FIGURE 4. Heterotrimeric ENaC composed of two subunits form functional channels. (AâG) Effect of amiloride (10 μM) application on heterotrimeric ENaC currents of various subunit combinations (αβγ, αβ, αγ, βγ, δβγ, δβ, and δγ). (H) Dose response curves for amiloride were fitted and derived IC50 values were used for comparison (I). Amiloride sensitivity of αβ and αγ ENaC was statistically not different when compared with αβγ, whereas βγ ENaC displays a significantly increased IC50 value with respect to αβγ and αγ ENaC. (J) Dose-response curves for channels containing δ ENaC. (K) δγ displayed a significantly reduced amiloride IC50 value compared with δβγ, whereas δβ remains unchanged. Paired t-test (AâG) and one-way ANOVA with multiple comparison (I,K); **p < 0.01; ***p < 0.001; ****p < 0.0001.
|

|
FIGURE 5. Heterotrimeric ENaC composed of two subunits responds to SF. SF response of heterotrimeric ENaC composed of two different subunits was assessed. Left panels show representative current traces whereas the right panels show the averages ± SEM. All combinations of two different ENaC subunits, αβ (A), αγ (B), δβ (C), δγ (D), and βγ (E), were significantly activated by the application of SF (indicated as colored bar). (F) The SF response (I0.2/I0) of those ENaC subunit compositions was normalized with respect to canonical αβγ and δβγ ENaC. The SF effect of αβ and βγ was unchanged when compared with αβγ. A significantly increased SF response was observed for αγ when compared with αβγ. δγ ENaC shows also a significantly increased SF effect when compared with δβγ, whereas δβ was unchanged. Paired t-test (A–E) and one-way ANOVA with multiple comparison (F); **p < 0.01; ***p < 0.001; ****p < 0.0001.
|


