XB-IMG-137642
Xenbase Image ID: 137642
|
|
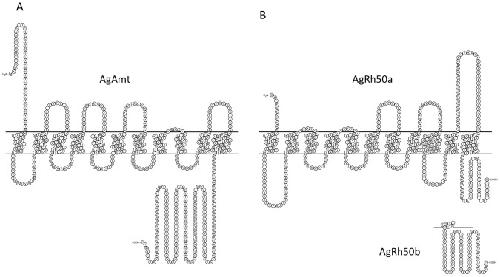
Figure 2. Amino acid plots of AgAmt (A) and AgRh50 (B) depicting the 11 transmembrane domains.AgRh50a and AgRh50b differ only in their C-terminal regions. Image published in: Pitts RJ et al. (2014) Image reproduced on Xenbase with permission of the publisher and the copyright holder. Creative Commons Attribution license Larger Image Printer Friendly View |