XB-IMG-152378
Xenbase Image ID: 152378
|
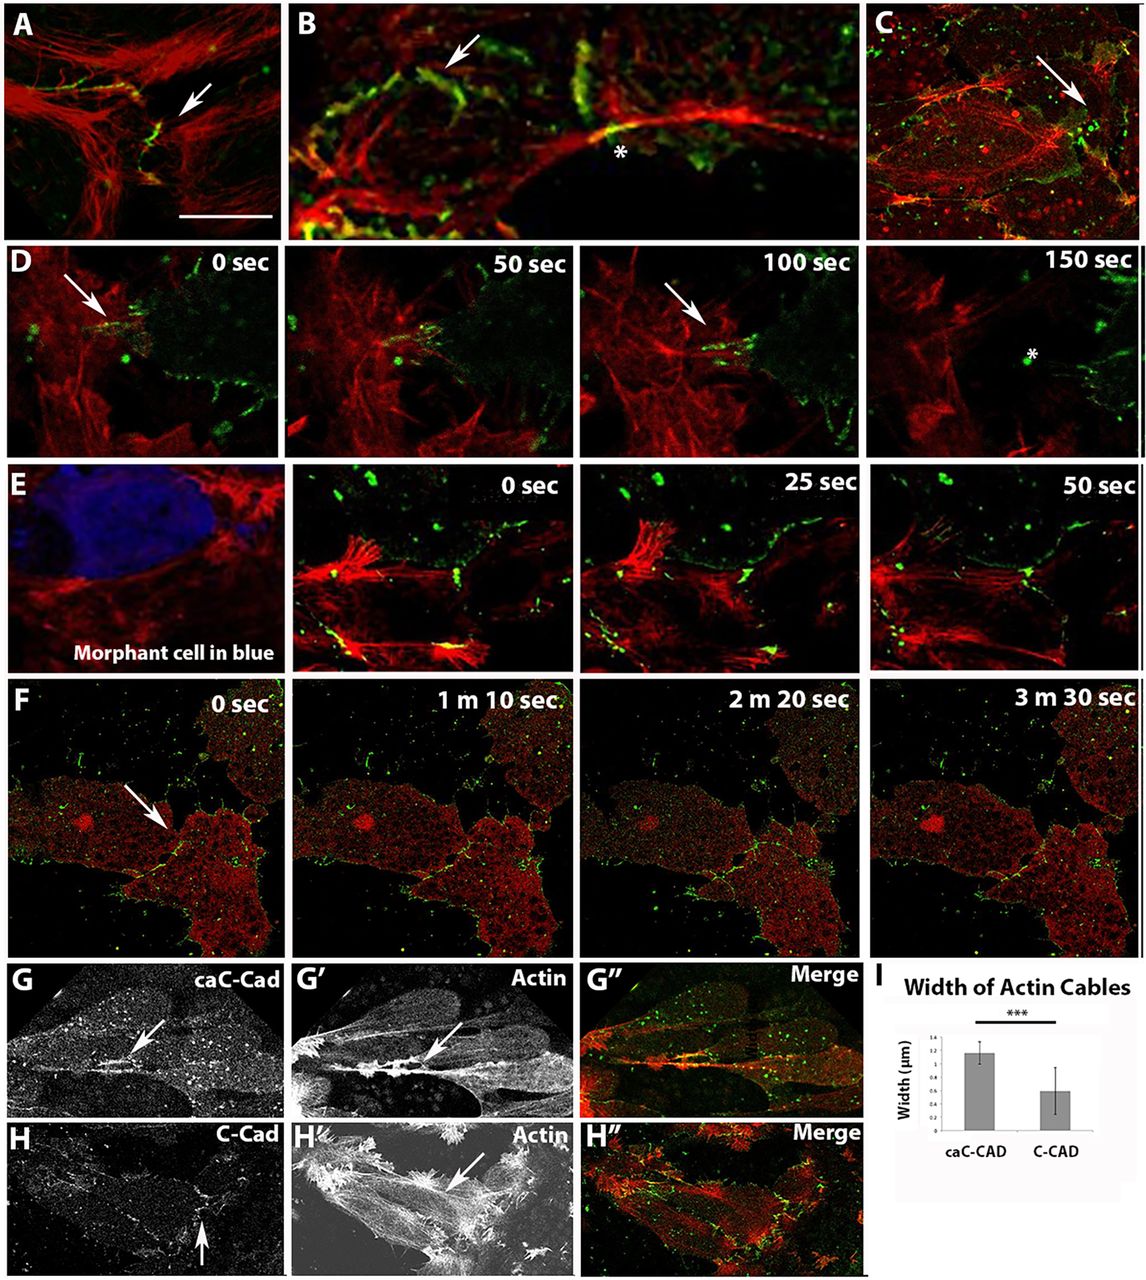
Fig. 6.
C-cadherin localization on lamellipodia depends on RLC. Actin is red and C-cadherin or caC-cadherin is green. (A,B) Cadherin forms puncta (arrow) on lamellipodia (A) that resolve into long plaques (arrow), linking actin cables from neighboring cells (B, asterisk). (C) By contrast, lamellipodia on RLC morphant cells maintain a cloud of diffuse C-cadherin signal (arrow) that does not resolve into puncta. (D) Time-lapse microscopy of C-cadherin dynamics in adjacent control cells labeled singly for actin (left) or C-cadherin (right) display adhesions (arrows) that when broken, snap backwards rapidly (asterisk). (E) RLC MO-treated cells (co-injected with a blue dextran) do not make adhesions with neighboring control cells. (F) pnRLC-expressing morphant cells display little protrusive activity or adhesion remodeling (arrow). (G-I) Cells expressing caC-cadherin exhibit longer linear adhesion plaques than C-cadherin-expressing cells (arrows in G,H), which are associated with thicker actin cables (arrow in Gâ², quantified in I; n=20 widths per condition). Merged images are in Gâ²,Hâ². Scale bar in A is 20â
μm for all images. Error bars represent s.e.m. ***P<0.001. Image published in: Pfister K et al. (2016) Copyright © 2016. Image reproduced with permission of the Publisher and the copyright holder. This is an Open Access article distributed under the terms of the Creative Commons Attribution License.
Image source: Published Larger Image Printer Friendly View |