XB-IMG-193473
Xenbase Image ID: 193473
|
|
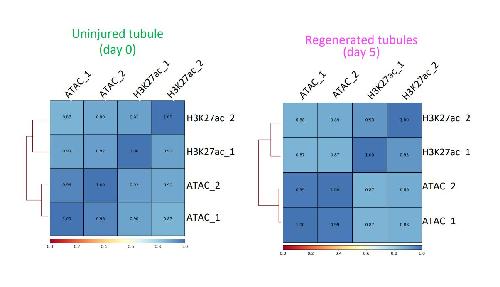
Fig. S3. Correlation analysis of ATAC-seq and ChIP-seq peaks. Hierarchically clustered correlation matrix of ATAC-seq and ChIP-seq peaks and their replicates (rep1 and rep2). Pearson correlations were calculated in deepTools (3.5.0) module multiBamSummary with default parameters. (B) Number of gained peaks and lost peaks in regenerating tubules (day 2). Image published in: Suzuki N et al. (2022) Copyright © 2022. Image reproduced with permission of the Publisher and the copyright holder. This is an Open Access article distributed under the terms of the Creative Commons Attribution License. Larger Image Printer Friendly View |