Quantitative Proteomics After Spinal Cord Injury
Mol Cell Proteomics. April 1, 2018; 17 (4): 592-606.
Quantitative Proteomics After Spinal Cord Injury (SCI) in a Regenerative and a Nonregenerative Stage in the Frog Xenopus laevis .
Lee-Liu D, Sun L, Dovichi NJ, Larraín J.
Abstract
The capacity to regenerate the spinal cord after an injury is a coveted trait that only a limited group of nonmammalian organisms can achieve. In Xenopus laevis, this capacity is only present during larval or tadpole stages, but is absent during postmetamorphic frog stages. This provides an excellent model for comparative studies between a regenerative and a nonregenerative stage to identify the cellular and molecular mechanisms that explain this difference in regenerative potential. Here, we used iTRAQ chemistry to obtain a quantitative proteome of the spinal cord 1 day after a transection injury in regenerative and nonregenerative stage animals, and used sham operated animals as controls. We quantified a total of 6,384 proteins, with 172 showing significant differential expression in the regenerative stage and 240 in the nonregenerative stage, with an overlap of only 14 proteins. Functional enrichment analysis revealed that although the regenerative stage downregulated synapse/vesicle and mitochondrial proteins, the nonregenerative stage upregulated lipid metabolism proteins, and downregulated ribosomal and translation control proteins. Furthermore, STRING network analysis showed that proteins belonging to these groups are highly interconnected, providing interesting candidates for future functional studies. Data are available via ProteomeXchange with identifier PXD006993.
Click here to view article at Pubmed.
Click here to view article at Pubmed Central.
Click here to view article at Molecular & Cellular Proteomics.
Click here to view article on Xenbase.

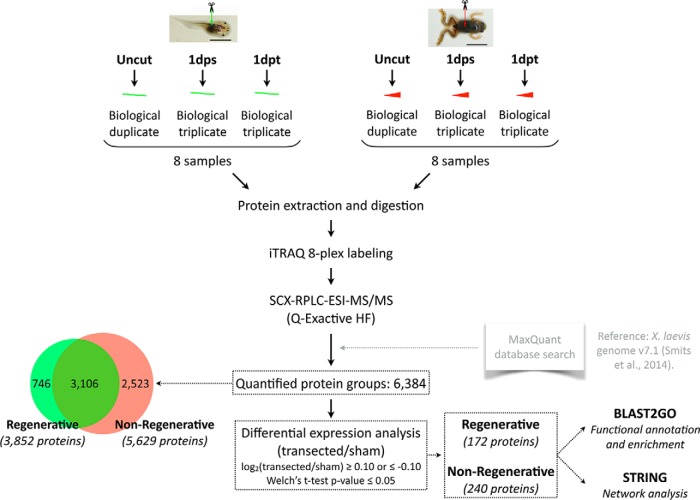
Fig. 1. Experimental workflow. One iTRAQ 8-plex experiment for each stage (regenerative, left; nonregenerative, right) was performed, including duplicate uncut samples, and triplicate sham (1dps) and transected (1dpt) samples isolated 1 day after surgery. Two iTRAQ channels were used for labeling of duplicate uncut samples. Three iTRAQ channels were used for labeling of triplicate sham (1dps) samples, and the remaining three channels for triplicate transected (1dpt) samples. Approximately 0.95 million tandem mass spectra were acquired, which corresponded to over 50,000 peptide sequences, and 7859 identified protein groups. 6384 had quantifiable levels, corresponding to 3852 proteins in the regenerative stage, and 5629 proteins in the nonregenerative stage (overlap: 3106 proteins quantified in both stages). Analysis identified 172 differentially expressed proteins in the regenerative stage, and 240 proteins in the nonregenerative stage. Functional analyses were performed using BLAST2GO and STRING for differentially expressed proteins.

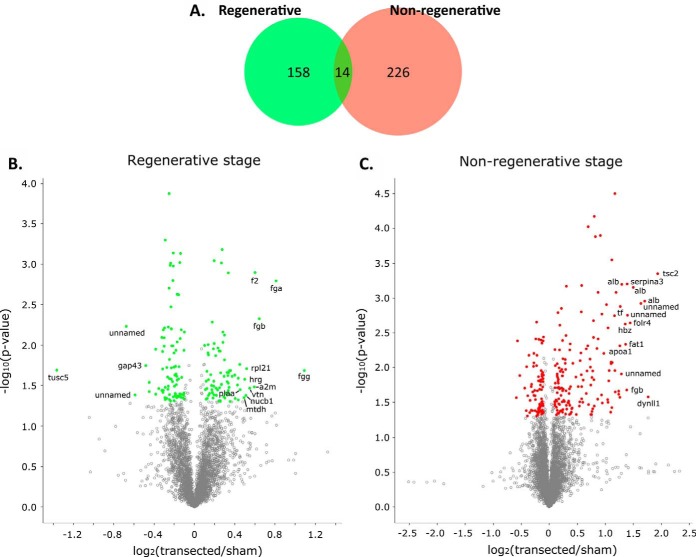
Fig. 3. Proteins showing differential expression when comparing transected and sham-operated animals. Differentially expressed proteins were determined using a Welch's t test (p value < 0.05) and an additional log2 (transected/sham) ≥ 0.10 or ≤ −0.10 fold-change filter. A, Venn diagram showing the number of proteins meeting differential expression criteria for each stage, distributed into those which did so in the regenerative, nonregenerative stage, or both. B, C, Volcano plots showing log2 (transected/sham) fold-change (x-axis) and -log10 (p value) (x-axis) for all quantified proteins in the regenerative (B) or the nonregenerative stage (C). Colored dots indicate proteins meeting differential expression criteria, and labels show gene symbols for top 15 proteins with highest fold-change. Regenerative- green; nonregenerative- red.

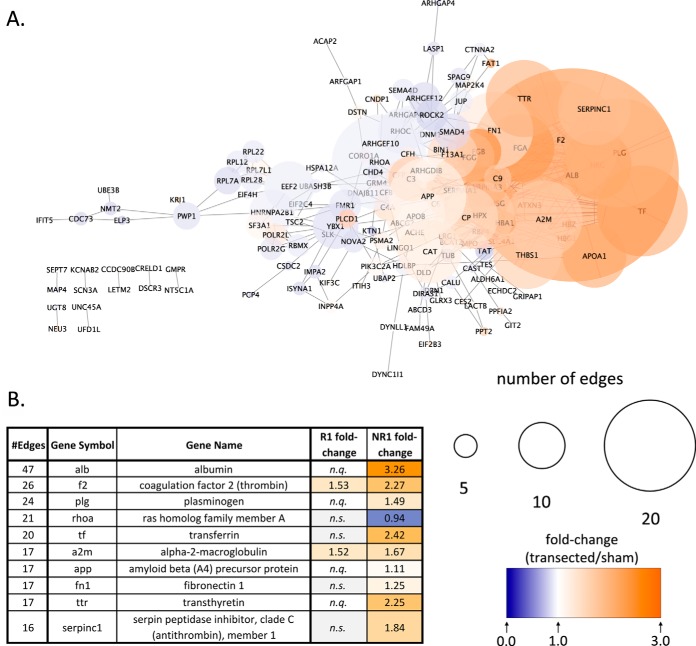
Fig. 7. STRING network analysis for differentially expressed proteins in the NR-stage.
Adapted with permission from American Society for Biochemistry and Molecular Biology: Lee-Liu et al. (2018). Quantitative Proteomics After Spinal Cord Injury (SCI) in a Regenerative and a Nonregenerative Stage in the Frog Xenopus laevis. Mol Cell Proteomics. April 1, 2018; 17 (4): 592-606. Copyright (2018).
This work is licensed under a Creative Commons Attribution 4.0 International License. The images or other third party material in this article are included in the article’s Creative Commons license, unless indicated otherwise in the credit line; if the material is not included under the Creative Commons license, users will need to obtain permission from the license holder to reproduce the material. To view a copy of this license, visit http://creativecommons.org/licenses/by/4.0/
Last Updated: 2018-04-09