Single-cell profiling of Xenopus mucociliary epithelium
The tissue system of the respiratory tract consists of multiple cell types, collectively called mucociliary epithelium. The specialized mucociliary cells enable the function and protection of the airways by providing a defensive barrier against pathogens, dirt, and bacteria, enabling liquid flow, clearance of trapped particles, and maintaining osmotic, ionic, and acid-base levels. How individual cells differentiate from earliest progenitors to form the different cell types has been challenging to study. Using state-of-art sensitive single-cell sequencing technologies and computational methods, we uncover how mucociliary cell types are formed and find evidence for a model wherein cells in a continuous non-hierarchical manner, make decisions. This work sheds light on normal mucociliary development and provides avenues to study dysregulated epithelium in diseases like asthma or COPD.
A single-cell, time-resolved profiling of Xenopus mucociliary epithelium reveals nonhierarchical model of development.
Sci Adv 2023 Apr 07;914:eadd5745. doi: 10.1126/sciadv.add5745.
Lee J, Møller AF, Chae S, Bussek A, Park TJ, Kim Y, Lee HS, Pers TH, Kwon T, Sedzinski J, Natarajan KN
Click here to view article at Science Advances.
Click here to view article on PubMed.
Click here to view article on Xenbase.
Abstract
The specialized cell types of the mucociliary epithelium (MCE) lining the respiratory tract enable continuous airway clearing, with its defects leading to chronic respiratory diseases. The molecular mechanisms driving cell fate acquisition and temporal specialization during mucociliary epithelial development remain largely unknown. Here, we profile the developing Xenopus MCE from pluripotent to mature stages by single-cell transcriptomics, identifying multipotent early epithelial progenitors that execute multilineage cues before specializing into late-stage ionocytes and goblet and basal cells. Combining in silico lineage inference, in situ hybridization, and single-cell multiplexed RNA imaging, we capture the initial bifurcation into early epithelial and multiciliated progenitors and chart cell type emergence and fate progression into specialized cell types. Comparative analysis of nine airway atlases reveals an evolutionary conserved transcriptional module in ciliated cells, whereas secretory and basal types execute distinct function-specific programs across vertebrates. We uncover a continuous nonhierarchical model of MCE development alongside a data resource for understanding respiratory biology.
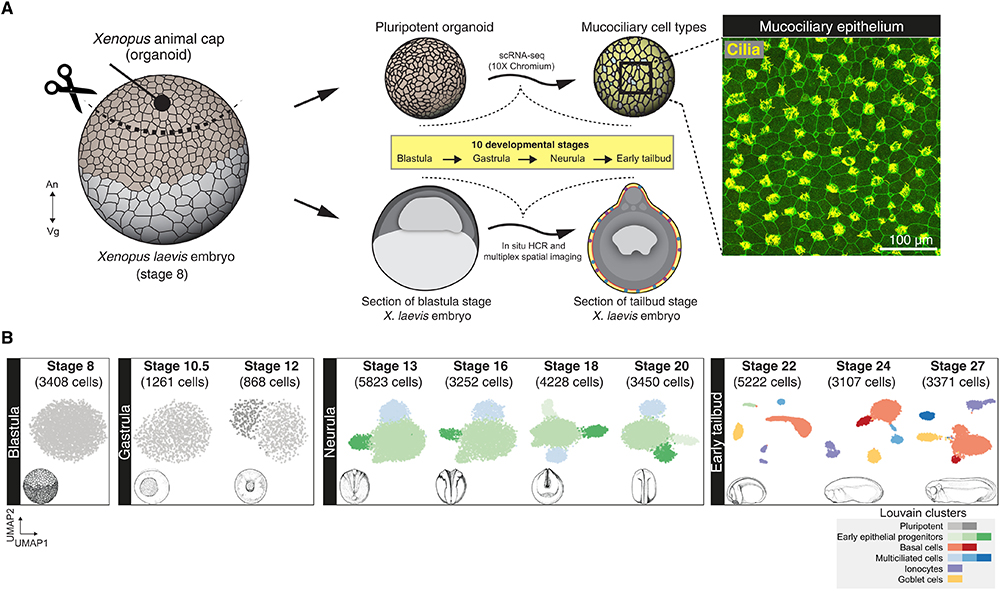
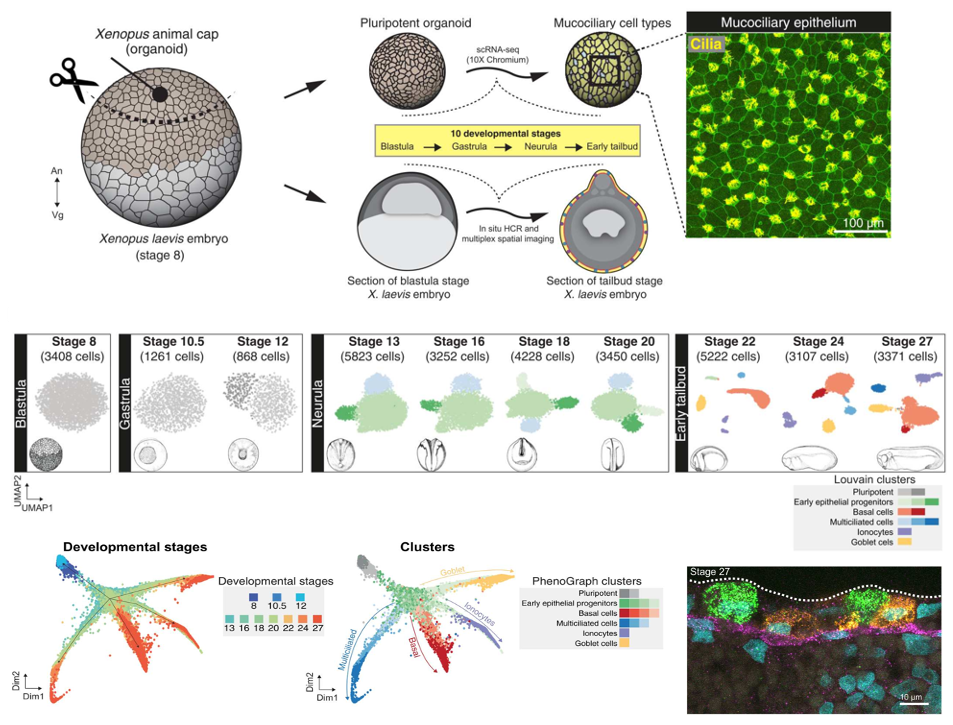
Fig. 1. Cellular composition of developing Xenopus MCE. (A) Schema for single-cell transcriptome profiling of developing Xenopus MCE. The animal pole tissues from blastula stage 8 embryos were cultured as organoids, sampled temporally across the 10 developmental stages (spanning blastula, gastrula, neurula, and early tailbud stages), and profiled by droplet scRNA-seq. Inset: Surface MCE of stage 27 organoids stained with anti–acetylated tubulin antibody (marking axonemes that build cilia; yellow) and phalloidin (marking filamentous actin; green). (B) Low-dimensional [UMAP (uniform manifold approximation and projection)] scRNA-seq visualization of the different developmental stages and Louvain clusters, colored based on major cell types.
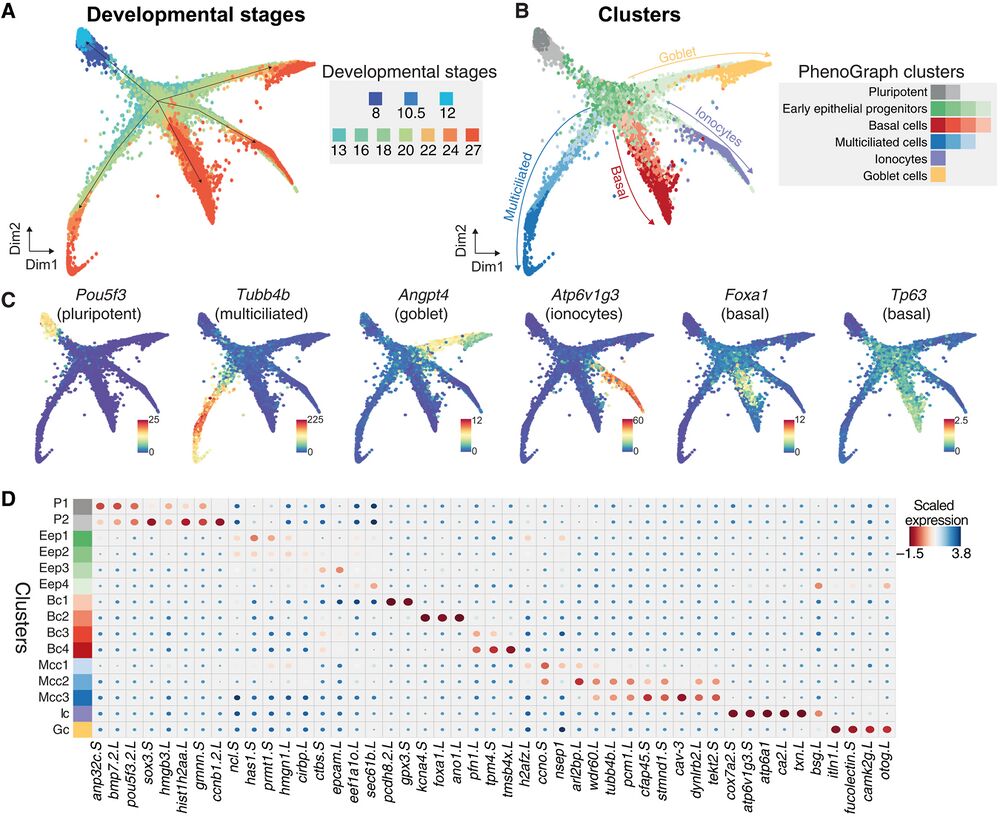
Fig. 2. Joint embedding of continuous MCE developmental manifold and cell-type differentiation. (A) High-density force-directed k-nearest neighbor (knn) graph visualization of single cells, colored by developmental stages. (B) PhenoGraph clustering of single cells over continuous MCE manifold, colored by different cell types and cell states (subclusters). The arrows indicate the differentiation of progenitors into specific cell types. (C) Expression patterns of marker genes for MCE cell types overlaid on the knn graph. The color bars indicated scaled imputed expression levels. (D) Dot plot of marker genes across different MCE clusters. The color represents maximum normalized mean marker gene expression across each cluster, and the size indicates the proportion of positive cells relative to the entire dataset.
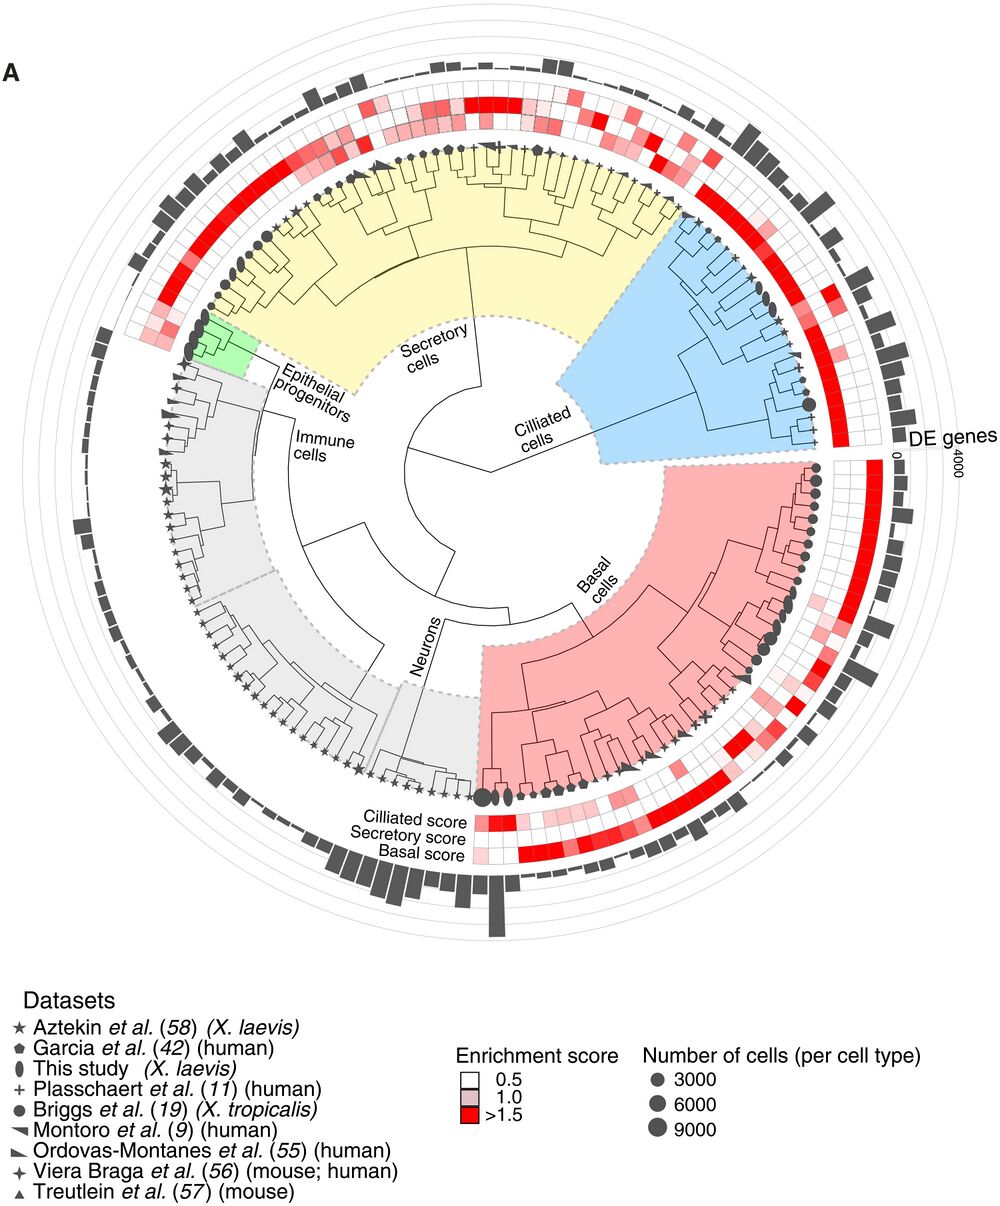
Fig. 10. Comparative analysis of MCE cell types and development. (A) Comparative analysis between Xenopus, mouse, and human mucociliary cells from nine single-cell airway atlases, using expressed orthologous gene sets. Using author-annotated cell type labels (shapes), a cell type enrichment score (ciliated, secretory, and basal; enriched scores in red) is calculated on the basis of differentially enriched genes (gray bars), which classified the different cell types into basal, ciliated, secretory, and other cell types (immune and neuronal). The four early epithelial progenitor clusters together with secretory cell types. The shapes indicate the respective study, shape sizes indicate the scaled number of cells within each author-annotated cell type, and gray histograms indicate the number of differentially enriched genes per author-annotated cell type. The legend further indicates the respective study, organism type, and species; coloring of enrichment score and sizes indicates the number of cells per author-annotated cell type.
Adapted with permission from the American Association for the Advancement of Science on behalf of Science Advances: Lee et al. (2023). A single-cell, time-resolved profiling of Xenopus mucociliary epithelium reveals nonhierarchical model of development. Sci Adv 2023 Apr 07;914:eadd5745. doi: 10.1126/sciadv.add5745.
This work is licensed under a Creative Commons Attribution 4.0 International License. The images or other third party material in this article are included in the article’s Creative Commons license, unless indicated otherwise in the credit line; if the material is not included under the Creative Commons license, users will need to obtain permission from the license holder to reproduce the material. To view a copy of this license, visit http://creativecommons.org/licenses/by/4.0/
Last Updated: 2023-04-25