XB-IMG-194816
Xenbase Image ID: 194816
|
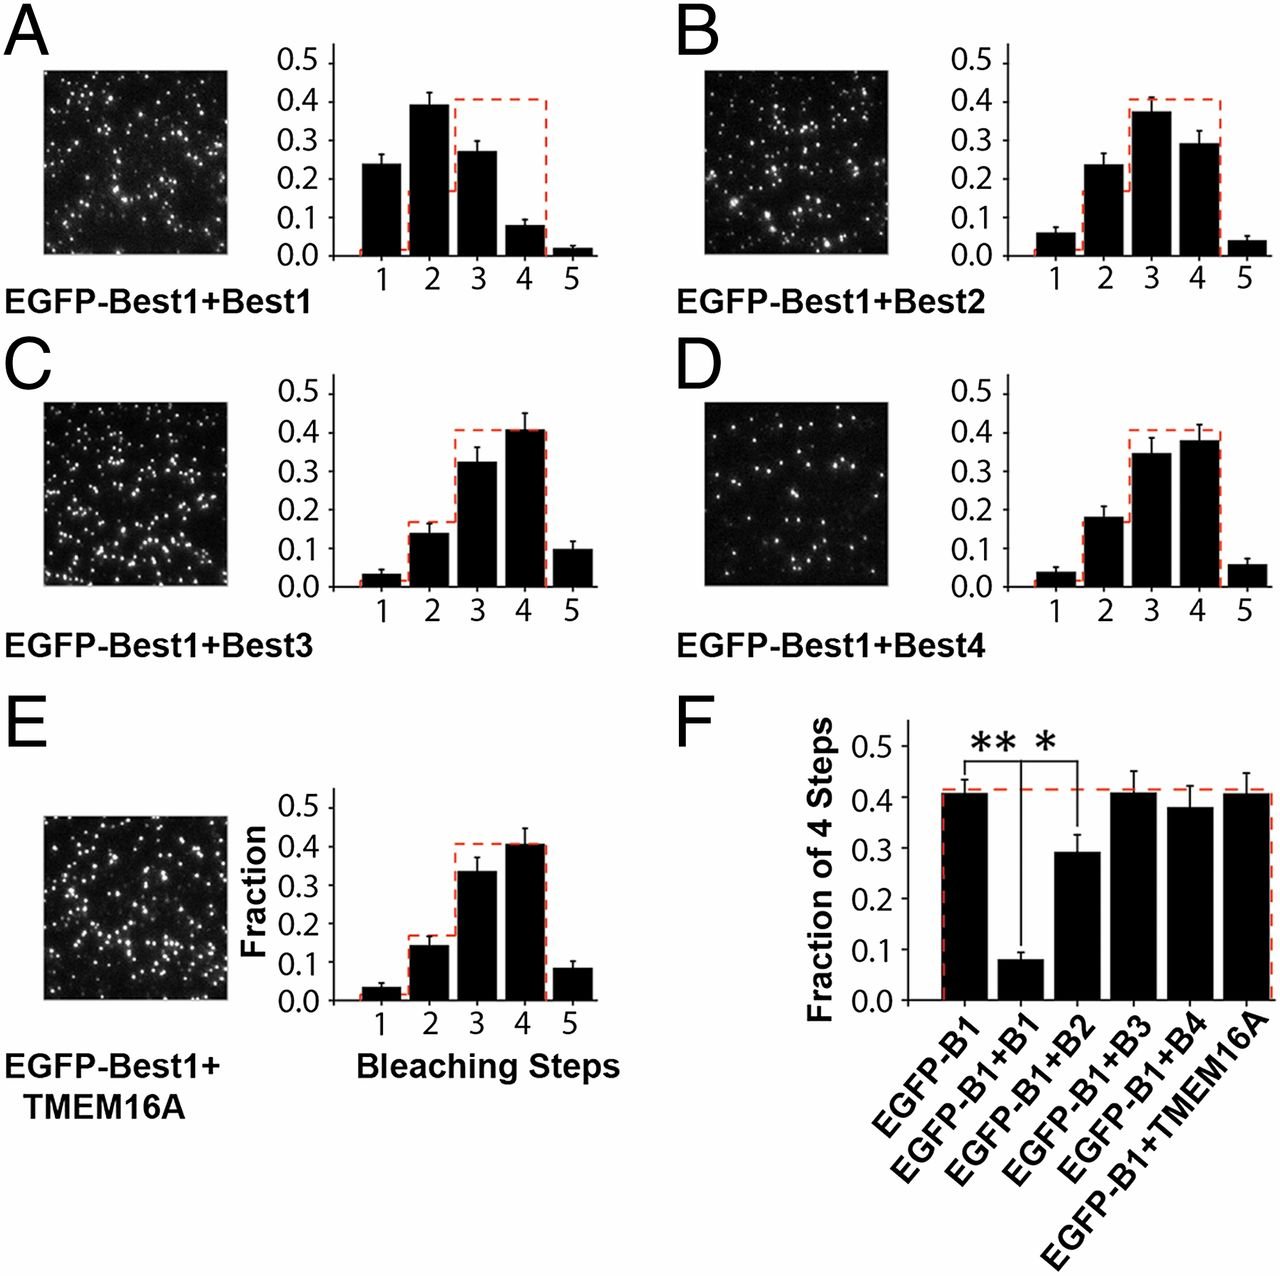
Fig. 3.
Gauging coassembly of hBest1 with other CACC subunits by shifts in single-molecule subunit counts of mEGFP–hBest1. (A–E) Frequency distributions of single-molecule–photobleaching counts of mEGFP–hBest1 coexpressed with untagged hBest1 (number of optical patches n = 6) (A), hBest2 (n = 7) (B), hBest3 (n = 5) (C), hBest4 (n = 4) (D), or mTMEM16A (n = 5) (E), compared with the binomial distribution of tetramer with the probability that mEGFP is fluorescent = 0.8 (red dashed lines). (F) Fraction of spots with four bleaching steps when mEGFP–hBest1 is expressed alone (mEGFP–B1) or together with untagged hBestx (mEGFP–hBest1 + Bx) or untagged mTMEM16A (mEGFP–hBest1 + mTMEM16A). Image published in: Bharill S et al. (2014) Copyright © 2014. Image reproduced with permission of the Publisher and the copyright holder. This is an Open Access article distributed under the terms of the Creative Commons Attribution License. Larger Image Printer Friendly View |