XB-IMG-125780
Xenbase Image ID: 125780
|
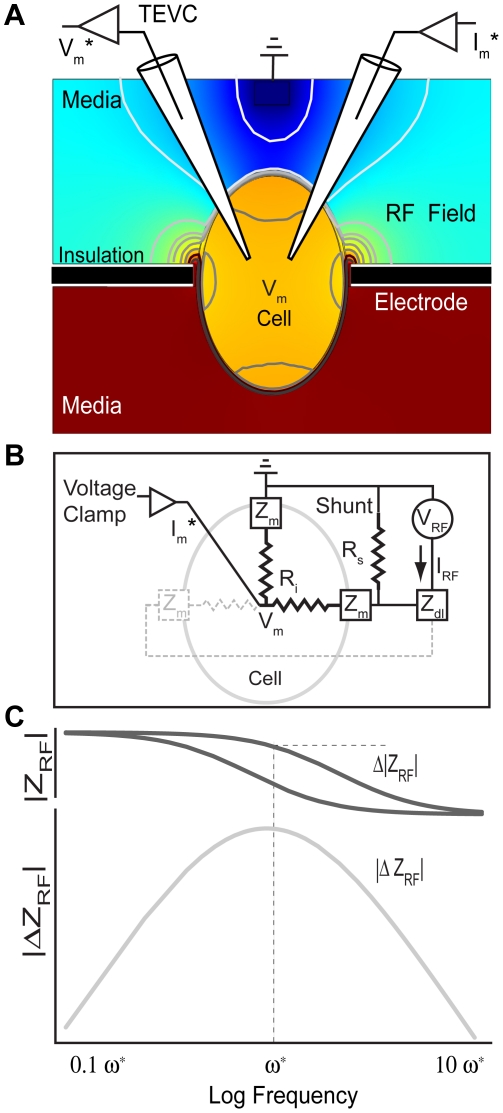
Figure 1. Set-up and circuit model.A) Changes in RF membrane impedance (|ΔZRF|) during TEVC were measured by passing RF current from an electrode surrounding the meridian of the cell (black) to a ground electrode (media, above the cell). Contour lines and colors of the saggital cross-section of a cell in the recording chamber, shown here, illustrate the general spatial distribution of the RF electric potential expected based on the Maxwell equations for a passive cell under axisymmetric conditions (π/4 phase shown). B) A circuit model of the chamber including the shunt resistance (Rs,), membrane impedance (Zm), intracellular resistance (Ri), and electrode double layer (Zdl). C) Using the circuit model, the frequency-dependent RF impedance would change (Δ|ZRF|) with an increase or decrease in membrane capacitance — a change that would be most easily detectable at frequency ω* where the maxima of the |ΔZRF| occurs. The present study reports changes in RF impedance |ΔZRF| evoked by TEVC step changes in membrane potential. Image published in: Dharia S and Rabbitt RD (2011) Dharia, Rabbitt. Creative Commons Attribution license Larger Image Printer Friendly View |