XB-IMG-120982
Xenbase Image ID: 120982
|
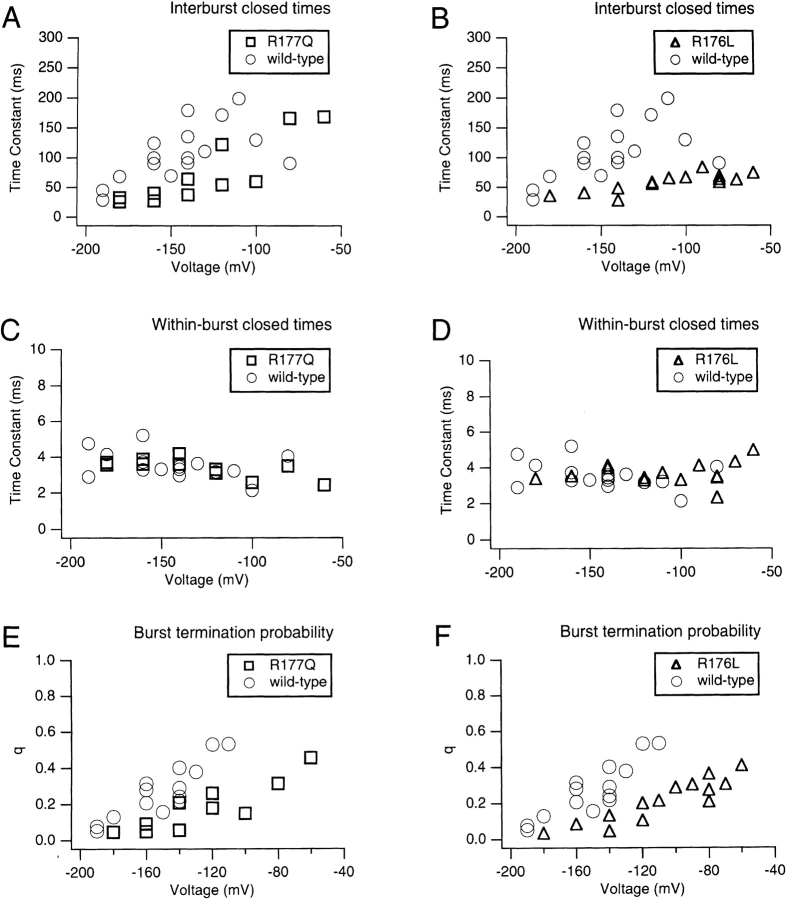
Figure 21. (A and B) Time constants from single exponential fits to interburst closed time distributions for R177Q (□) and R176L (▵) currents are plotted as functions of voltage (□). Interburst duration distribution time constants from wild-type KAT1 currents are superimposed (○). (C and D) The time constants from single exponential fits to the within-burst closed time distributions for R177Q (□) and R176L (▵) currents are plotted as functions of voltage. Corresponding time constants from wild-type KAT1 currents are superimposed (○). (E and F) The probability of terminating a burst (q) derived from geometric fits to the distributions of the number of openings per burst is plotted as functions of voltage for R177Q (□) and R176L (▵) currents. Corresponding data for wild-type KAT1 currents are superimposed for comparison. A burst criterion of 20 ms was used in all analysis in this figure. Image published in: Zei PC and Aldrich RW (1998) Image reproduced on Xenbase with permission of the publisher and the copyright holder. Creative Commons Attribution-NonCommercial-ShareAlike license Larger Image Printer Friendly View |