Click here to close
Hello! We notice that you are using Internet Explorer, which is not supported by Xenbase and may cause the site to display incorrectly.
We suggest using a current version of Chrome,
FireFox, or Safari.
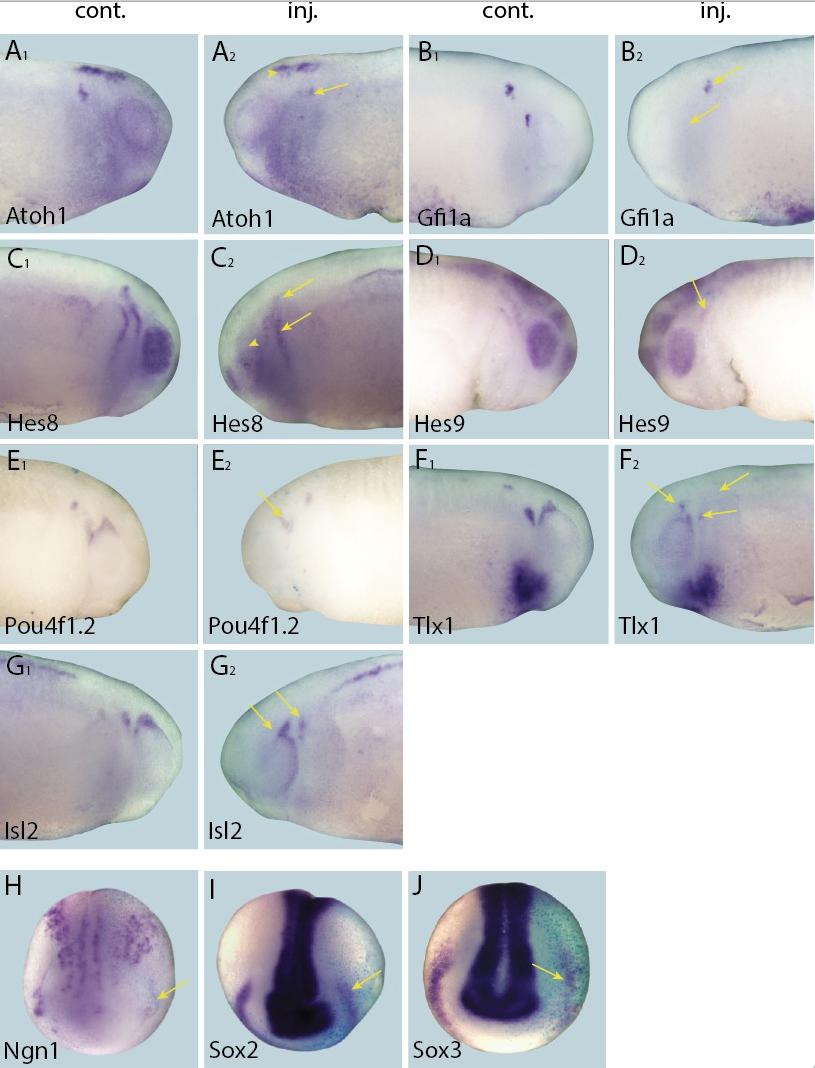
Figure 5.
Effects of Eya1 knockdown on target genes.
Tail bud (AâG) and neural plate (HâI) stage embryos after unilateral injection of Eya1-MO1+2. In each case, lacZ was co-injected as a lineage tracer and panels A1âG1 show the control (un-injected) side and A2âG2 show the injected side (lacZ staining out of frame in most specimens). The injected side is positioned to the right in HâJ, as marked by blue lacZ staining. Arrows and arrowheads mark reductions in marker gene expression in placodal and non-placodal derivatives, respectively.