XB-IMG-156434
Xenbase Image ID: 156434
|
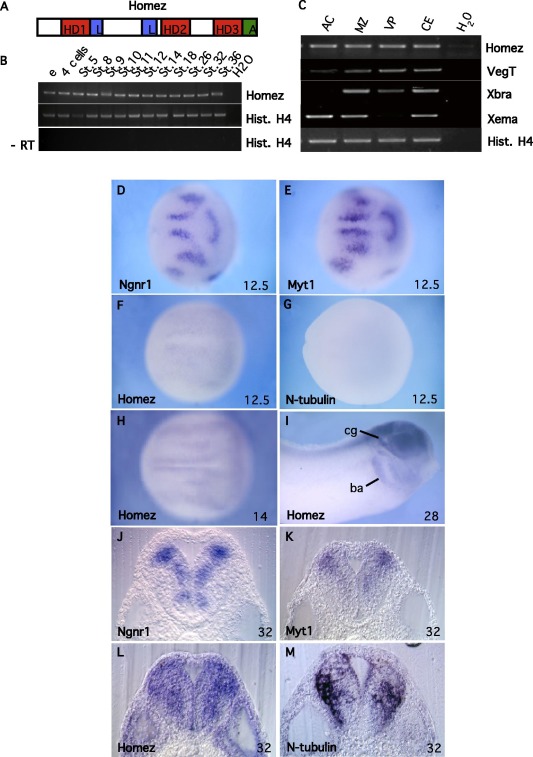
Fig. 1. Homez structure and gene expression during embryogenesis. (A) Shematic representation of the Homez protein. HD, homeodomain; L, leucine repeats, A, acidic
domain. (B) Temporal expression of Homez by RT-PCR. RNA was extracted from embryos at the indicated stages. (C) RT-PCR analysis of Homez expression in dissected explants
of stage 10.5 embryos. The endodermal VegT, mesodermal Xbra and ectodermal Xema markers were used as dissection controls. In B and C, Histone H4 was used as a loading
control. -RT, control RT-PCR without reverse transcriptase. (D-I) Spatial expression of Homez compared to that of Ngnr1, Myt1 and N-tubulin analyzed by whole-mount in situ
hybridization. Nieuwkoop-Faber stages are indicated. (DâH) Dorsal views. (I) Lateral view. Stripes of Homez expression in the domains of primary neurogenesis in the
posterior neural plate are indicated (l, lateral; i intermediate; m, medial). Note that Homez is activated in the domains of primary neurogenesis at E12.5 when N-tubulin is not
yet detectable. (JâM) Homez expression compared to that of Ngnr1, Myt1 and N-tubulin in the neural tube of stage 32 embryos. Sections at the level of the otic vesicle are
shown. Note that XHomez+ cells are detected more medially than N-tubulin in the marginal zone. Abbreviations: AC, animal caps; ba, branchial arches; cg, cranial ganglia; e,
egg; CE, control embryo; MZ, marginal zone; VP, vegetal pole. Image published in: Ghimouz R et al. (2011) Copyright © 2011. Image reproduced with permission of the Publisher, Elsevier B. V.
Image source: Published Larger Image Printer Friendly View |