XB-IMG-171123
Xenbase Image ID: 171123
|
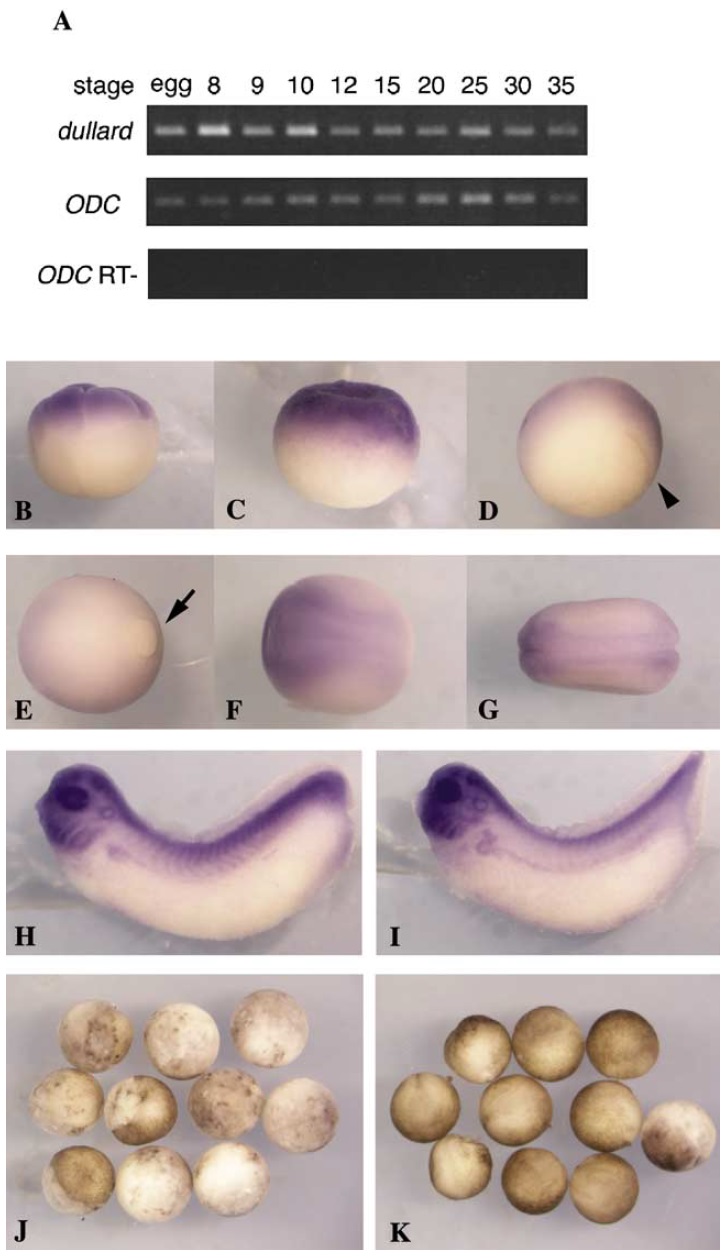
Fig. 2. (AâI) Temporal and spatial expression patterns of dullard. (A)
RT-PCR analysis was performed at the various stages indicated above
the lanes. From egg to stage 35, similar levels oftranscript were present.
(BâI) Whole mount in situ hybridization analysis of dullard expression.
(BâD) The transcripts localized to the animal hemisphere of
the embryo before the gastrula stage. (B) Eight-cell stage, lateral view.
(C) Stage 8, lateral view. (D) Stage 10.5, ventro-lateral view. (EâG) As
gastrulation proceeded, expression became restricted to the neural
region. (E) Stage 12, lateral view. (F) Stage 15, dorsal view. (G) Stage
20, dorsal view. (H, I) Expression subsequently localized to the neural
tissues, branchial arches, and pronephroi at the tail-bud stages. (H)
Stage 28, lateral view. (I) Stage 33, lateral view. Animal pole is towards
the top (BâD) and anterior is to the left (EâI). The arrowhead in (D)
and arrow in (E) indicate the dorsal lip and yolk plug, respectively.
(J, K) Overexpression of dullard caused apoptosis. (J) Dullard mRNA
(100 pg) was injected in one blastomere of2-cell embryos. White
mottled aspects were observed (95%, n ¼ 40). (K) Embryonic death
caused by overexpression of dullard was rescued by co-injection of
hBcl-2 mRNA (200 pg) (5% ofembryos exhibited white mottled aspects,
n ¼ 40). Image published in: Satow R et al. (2002) Copyright © 2002. Image reproduced with permission of the Publisher, Elsevier B. V.
Image source: Published Larger Image Printer Friendly View |